The following content is based on https://github.com/dgrtwo/gganimate
Install
if(!require(devtools)) install.packages("devtools")
if(!require(gganimate)) devtools::install_github("dgrtwo/gganimate")
The main argument is the frame ( the time frame/ time points in the argument). Treat frame as another aesthetics such as size, color, x and y. Then, use the gganimate() function.
Demo dataset
The dataset that will be used is gapminder. This is an excerpt of the Gapminder data on life expectancy, GDP per capita, and population by country. Let’s install the package to get the data and take a look on it.
if(!require(gapminder)) install.packages("gapminder")
# Loading the two libraries required
library(gapminder)
head(gapminder)
## # A tibble: 6 x 6
## country continent year lifeExp pop gdpPercap
## <fct> <fct> <int> <dbl> <int> <dbl>
## 1 Afghanistan Asia 1952 28.8 8425333 779.
## 2 Afghanistan Asia 1957 30.3 9240934 821.
## 3 Afghanistan Asia 1962 32.0 10267083 853.
## 4 Afghanistan Asia 1967 34.0 11537966 836.
## 5 Afghanistan Asia 1972 36.1 13079460 740.
## 6 Afghanistan Asia 1977 38.4 14880372 786.Simple Animation
- Build a scatterplot the Life Expectancy against gdp per capita across years.
- Use color and sizes to show the continents and population size.
** The only thing different from usual plotting is the frame aesthetics. Then, we use the gganimate() function**.
# Load required package
library(gapminder)
library(ggplot2)
library(gganimate)
## Basic Scatterplot
p <- ggplot(gapminder, mapping = aes(x = gdpPercap, y = lifeExp,
size = pop, color = continent, frame = year)) +
geom_point() +
scale_x_log10()
# Animation
gganimate(p)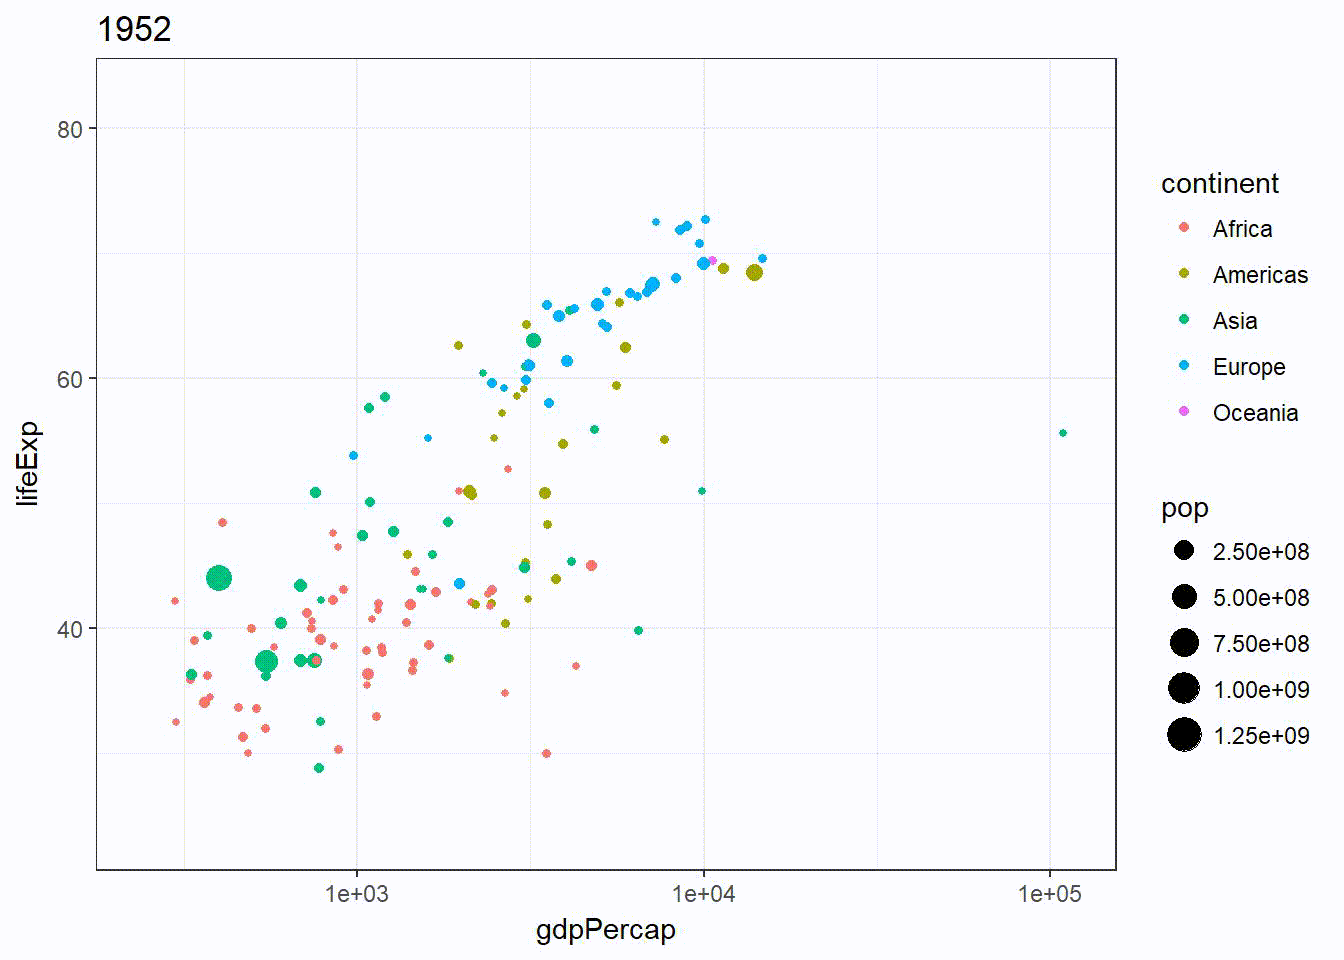 Note that the axis remains the same, making comparison across time easier.
Set fig.show = "animate" chunk option if you are using Rmd and knitr. Add in fig.show = "animate", ffmpeg.format=‘gif’, dev=‘jpeg’ if you are using blogdown.
The animation could be saved by the followings:
gganimate(p, "output.gif")
gganimate(p, "output.mp4")
gganimate(p, "output.swf")
gganimate(p, "output.html")
ffmpeg and ImageMagick drivers should be installed on your computer.
I met some problems with running the gganimate(p) and I found the following solution.
Solutions to “Installing #ImageMagick for #gganimate R package” errors
Fixing running gganimate() problem
Just in case that the page is removed in the future, I am going to copy and paste whatever is in that page:
Install ImageMagick through R
Do this through the following. Make sure to select legacy utilities whiles installing ImageMagick to install convert.exe on your machine.
if (!require("installr")){
install.packages("installr")
library(installr)
install.imagemagick("https://www.imagemagick.org/script/download.php"
} else {
library(installr)
install.imagemagick("https://www.imagemagick.org/script/download.php")
This downloads ImageMagick onto the PC. Rerun the gganimate() code after this step.
Error after installing ImageMagick
cannot find ImageMagick with convert = "convert"Install ImageMagick and point R path to its folder . Make sure to restart RStudio after pointing R path to its folder.
Path through R
Point R path to its folder in R using:
Sys.setenv(PATH = paste("C:/Program Files/ImageMagick/bin",
Sys.getenv("PATH"), sep = ";"))
Restart Rstudio
if the following error comes up after installing ImageMagick and directing R to its path. Just restart Rstudio.
C:\Program' is not recognized as an internal or external command,
operable program or batch file.
Customization
Highlight points (rather than moving them)
What if I want to highlight the change in the population throughout the years but not moving it?
All I need to do is to remove the frame aesthetics from the global chunk but add it into specific geom.
p2 <- ggplot(gapminder, mapping = aes(x = gdpPercap, y = lifeExp, size = pop)) +
  geom_point() +
  geom_point(aes(frame = year), color = "violetred") +
  scale_x_log10()

gganimate(p2)
Cumulative Layer
This can be done by adding an aesthetic cumulative = TRUE. It’s useful for building path over time. Also note that the group aesthetics is used so that it knows which variables to accumulate on.
p3 <- ggplot(gapminder, mapping = aes(x = gdpPercap, y = lifeExp, frame = year)) +
  geom_path(aes(cumulative = TRUE, group = country)) +
  scale_x_log10() +
  facet_wrap(~continent)

gganimate(p3)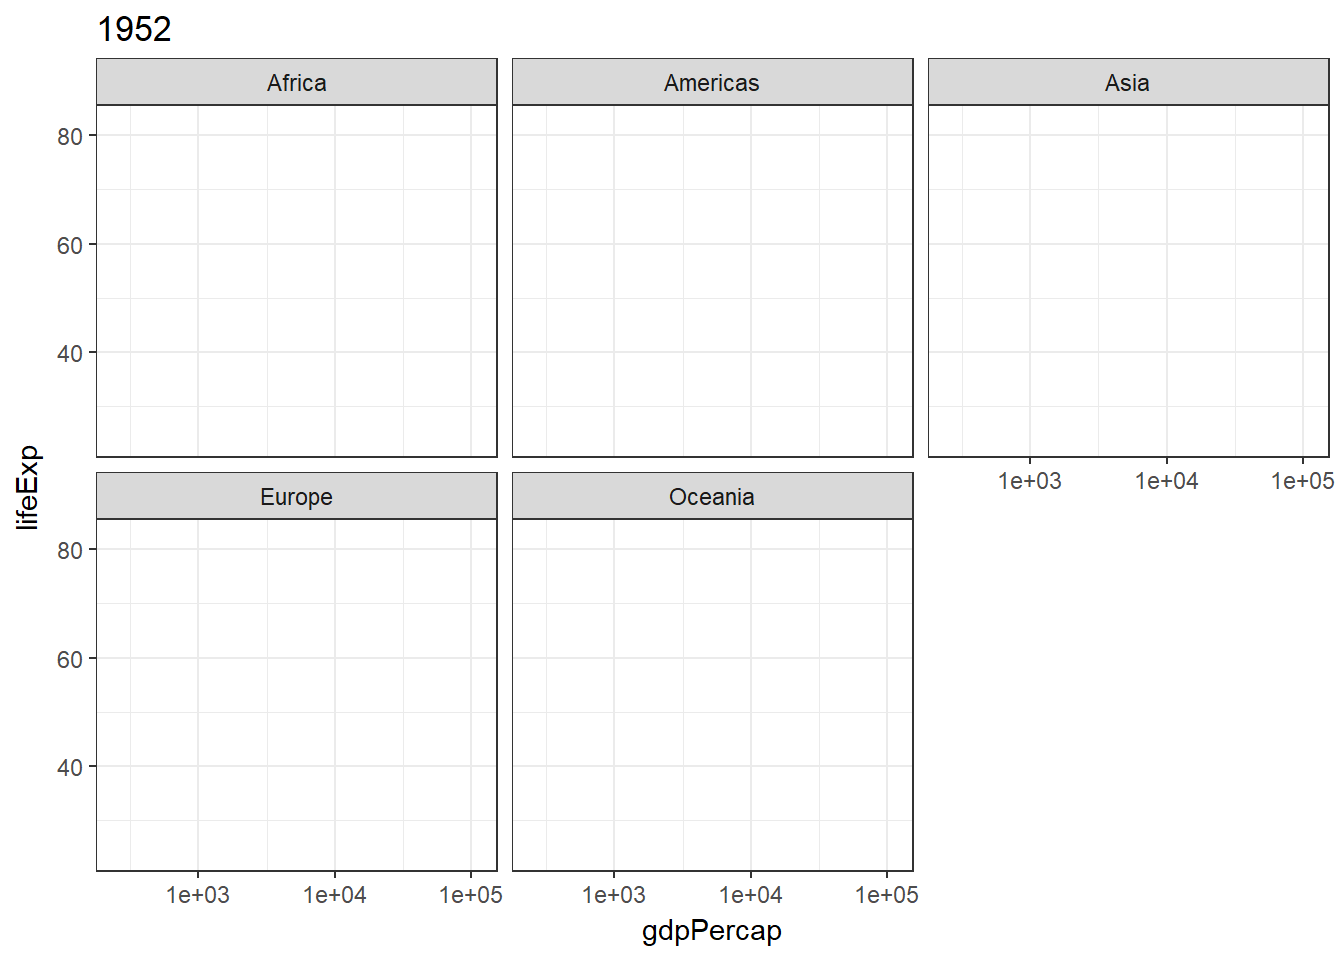
Matching frame with other dimension (variables)
Let’s try to match continent to frame aesthetics
p4 <- ggplot(gapminder,
             mapping = aes(x = gdpPercap, y = lifeExp, size = pop, frame = continent)) +
  geom_point(color = "blue") +
  scale_x_log10()

gganimate(p4)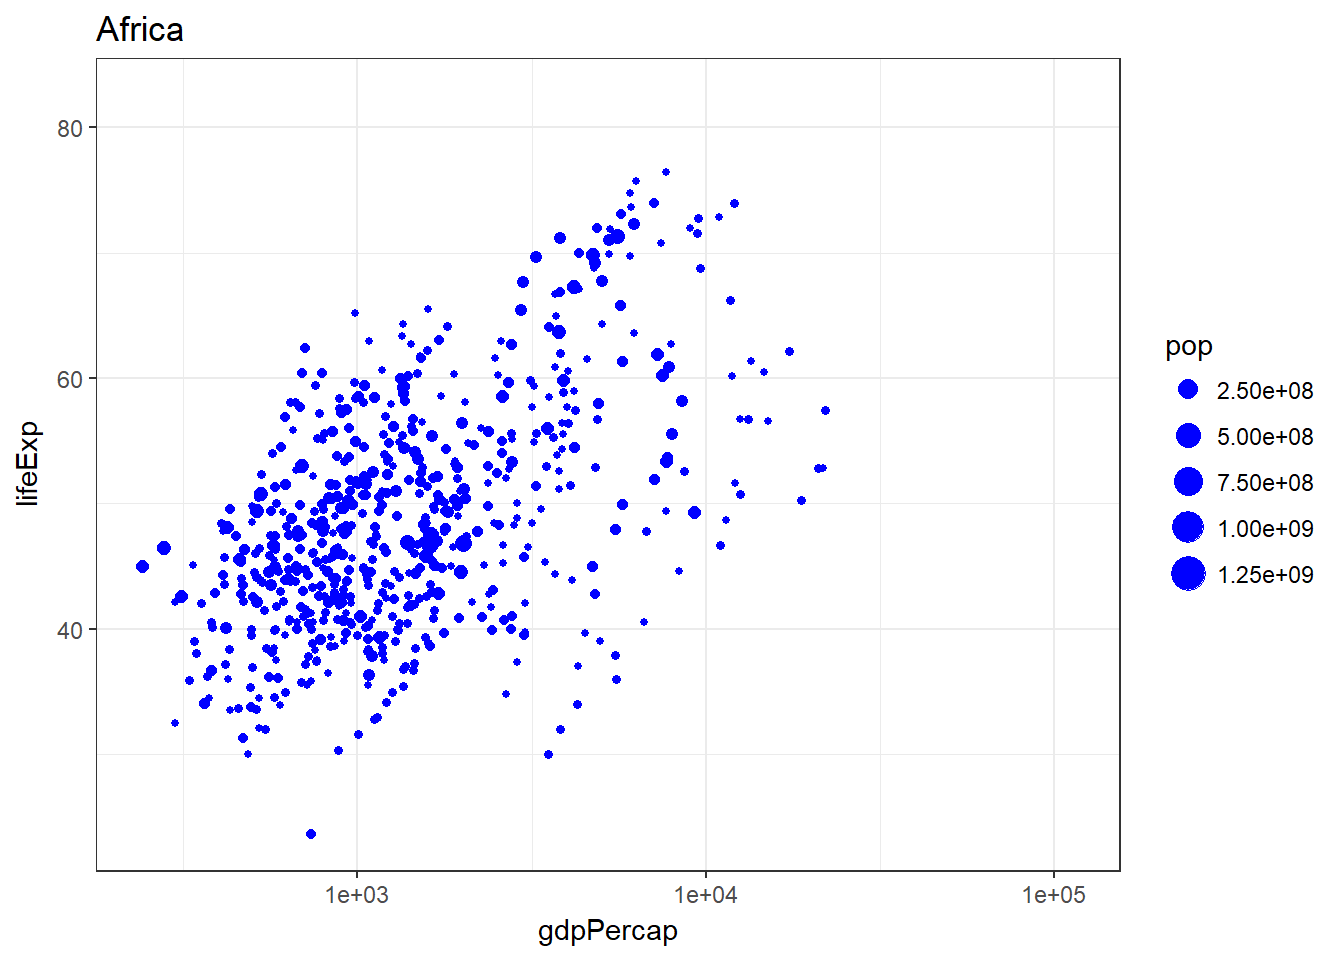
Statistics Summarization
Always add in group in the geom (such as geom_smoooth()) or the statistics will be calculated across all frames and thus be constant in animation.
scales = "free" was added because the range of x axis is fixed by default.
p5 <- ggplot(gapminder,
             mapping = aes(x = gdpPercap, y = lifeExp, size = pop, frame = year)) +
  geom_point() +
  geom_smooth(aes(group = year), method = "lm", show.legend = FALSE) +
  facet_wrap(~continent, scales = "free") +
  scale_x_log10()

gganimate(p5)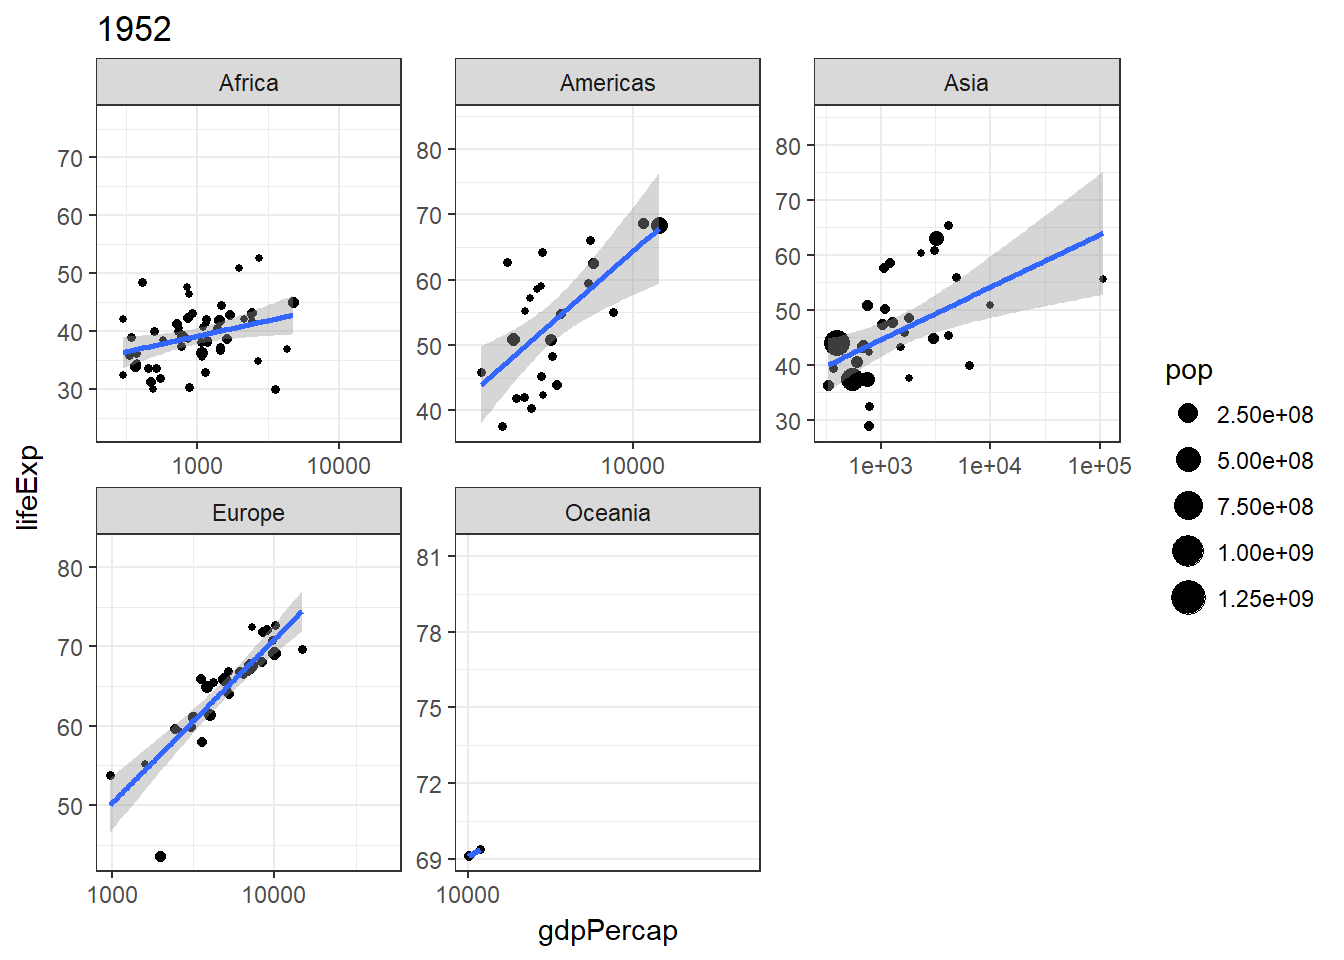
Animation Options
You can control your animation with the same options described in ani.options from the animation package, passed directly to gganimate or to ani.options beforehand. Note that you always need to add the parameters passed to gganimate to the chunks in the knitr of Rmd.
Now, let’s try to set the interval argument and make the animation goes faster.
We will start with passing the argument directly intto gganimate()
gganimate(p, interval = .2)
In fact, simply making the chunk to include interval = 0.2 is good enough in Rmd.
gganimate(p)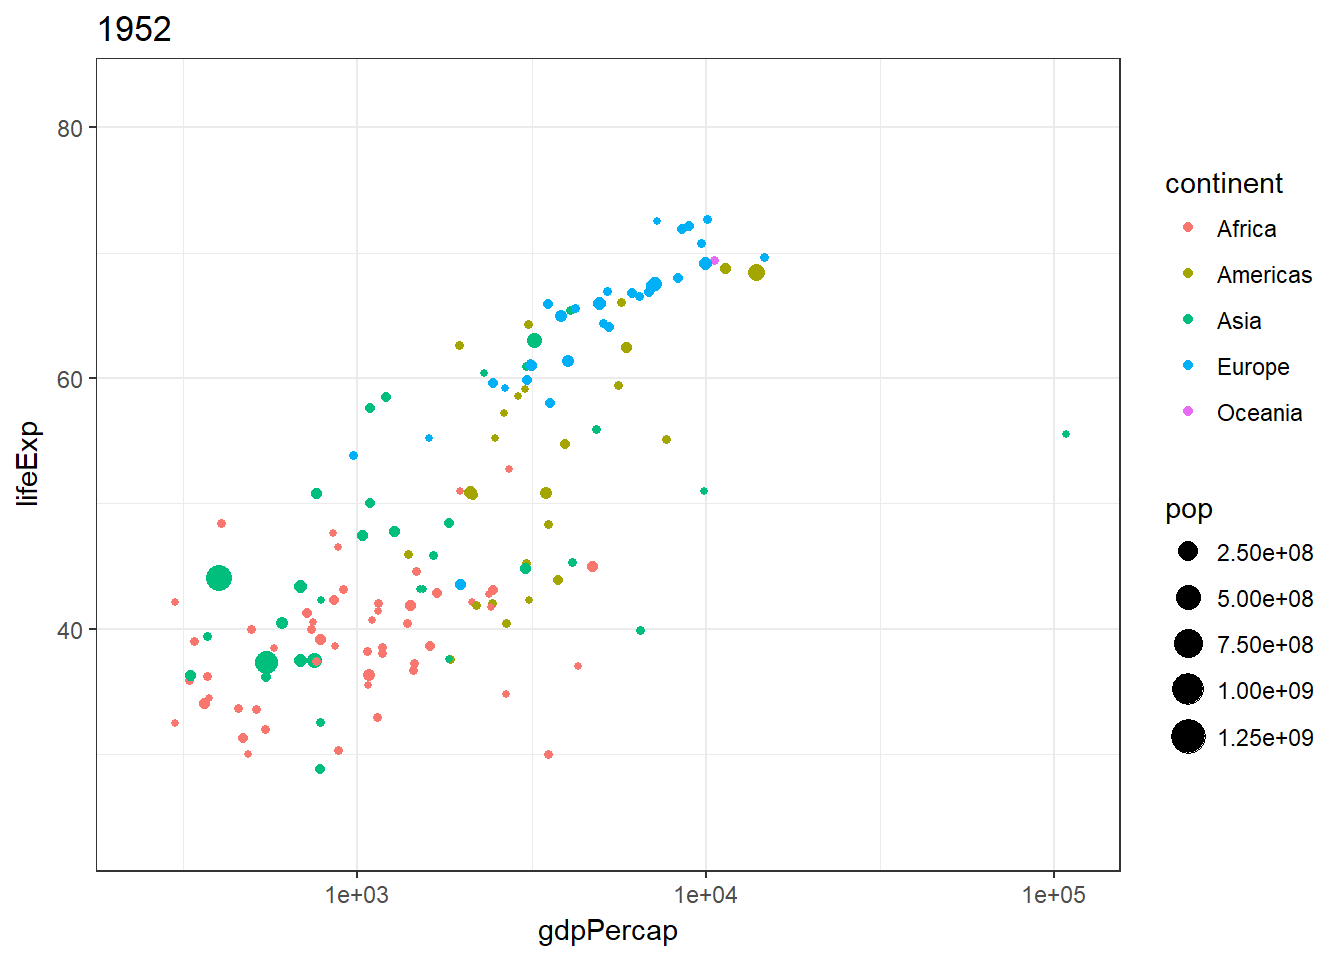
Let’s do the same thing but a instead using the ani.options. This is how you do it in Rstudio in general.
library(animation)
ani.options(interval = .2)
gganimate(p)